GraphQL Performance: How to Test & Optimize
Quickly identify potential DoS, Complexity, N+1 issues, and more.

Many developers tend to steer clear of GraphQL APIs due to concerns about performance issues. But is GraphQL generally worse at performance than REST? Or is this concern primarily rooted in developers lacking the appropriate tools to evaluate GraphQL performance effectively?
In this blog post, let's dive into GraphQL performance. We'll explore the factors that can influence GraphQL's efficiency and discuss strategies that can help developers manage performance issues when working with GraphQL APIs. By the end of this article, you should understand how you can automate testing to address performance concerns and get the most out of GraphQL for your projects.
What makes GraphQL APIs perform poorly?
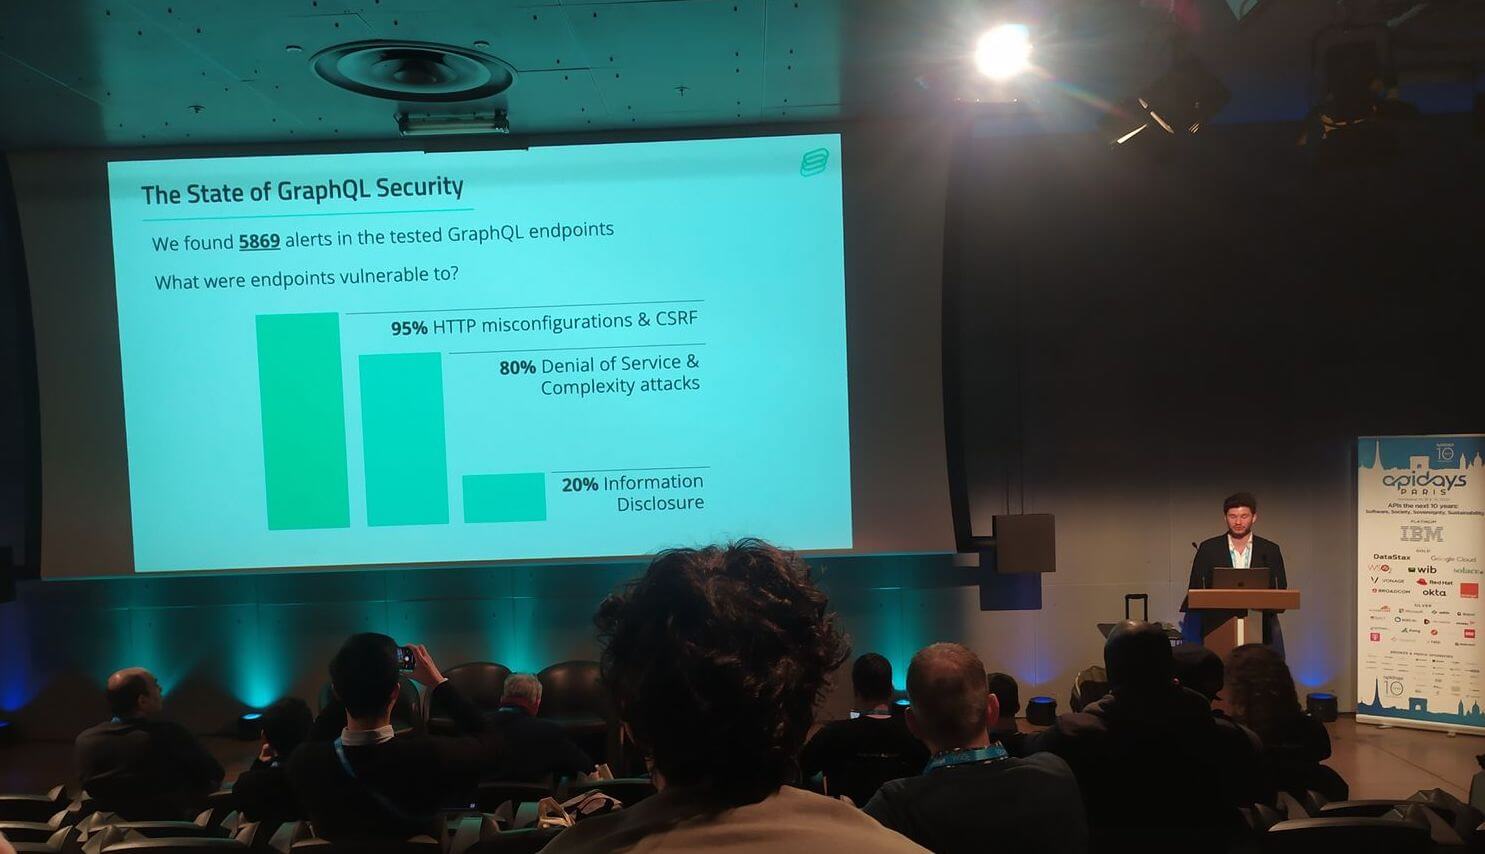
We found that 80% of all GraphQL endpoints scanned by Escape since its inception are vulnerable to Denial of Service (DoS) and Complexity attacks. That's a lot of APIs with performance problems!
GraphQL being a Query Language with user-supplied queries, an attacker can craft a request requiring a lot of resources for your server to process. All these requests have in common that they use little-known features of GraphQL.
DoS attacks are made more accessible by a GraphQL feature named aliasing. With GraphQL aliases, an attacker can call a resolver many times in the same query or mutation, bypassing HTTP-based rate limiting. 👉Read more about this vulnerability and its remediations.
Another common cause of performance issues is the ability of clients to nest GraphQL queries and even make them deeply recursive. That happens when your graph contains self-referencing objects. (e.g., a user has friends, who also have friends, who also have friends, etc.) Attackers can abuse this feature to cause CPU or memory exhaustion. 👉 Learn how it works and how you can protect your API here.
Performance issues may also result from the infamous "N+1 problem" in GraphQL. For instance, imagine we want to fetch all users' applications' names. The endpoint will fetch all users first, then resolve subsequent applications sequentially to get their names. We, therefore, have 1 request for the users plus N requests for the applications, one for each user.
query {
  users {
    id
    email
    applications {
        name
    }
  }
}
If the underlying storage of the endpoint is a relational database, logs will look like this:
-- Fetch all users
SELECT * FROM users;
-- Fetch applications for all users, sequentially
SELECT name FROM applications WHERE userId = 1;
SELECT name FROM applications WHERE userId = 2;
SELECT name FROM applications WHERE userId = 3;
SELECT name FROM applications WHERE userId = 4;
Last but not least, performance problems may also result from debug queries. As a developer, if you have a huge query that allows you to fetch most of your database, be sure to have at least two types of environments (dev and production), with debug queries disabled in production. We wrote two articles about best practices for the production environment: GraphQL Error Handling Best Practices for Security and When GraphQL Errors become a Security Issue.
Now, let's see how you can find those vulnerabilities.
How Escape DAST can help automate performance testing
While performance testing is crucial, doing it manually can be time-consuming and error-prone. This is where Escape comes in. Escape is designed to make security and performance testing faster and easier, without compromising on quality.
- Automated Performance Scanning
Escape DAST runs automated tests that simulate real-world usage patterns, identifying performance bottlenecks before they become issues.
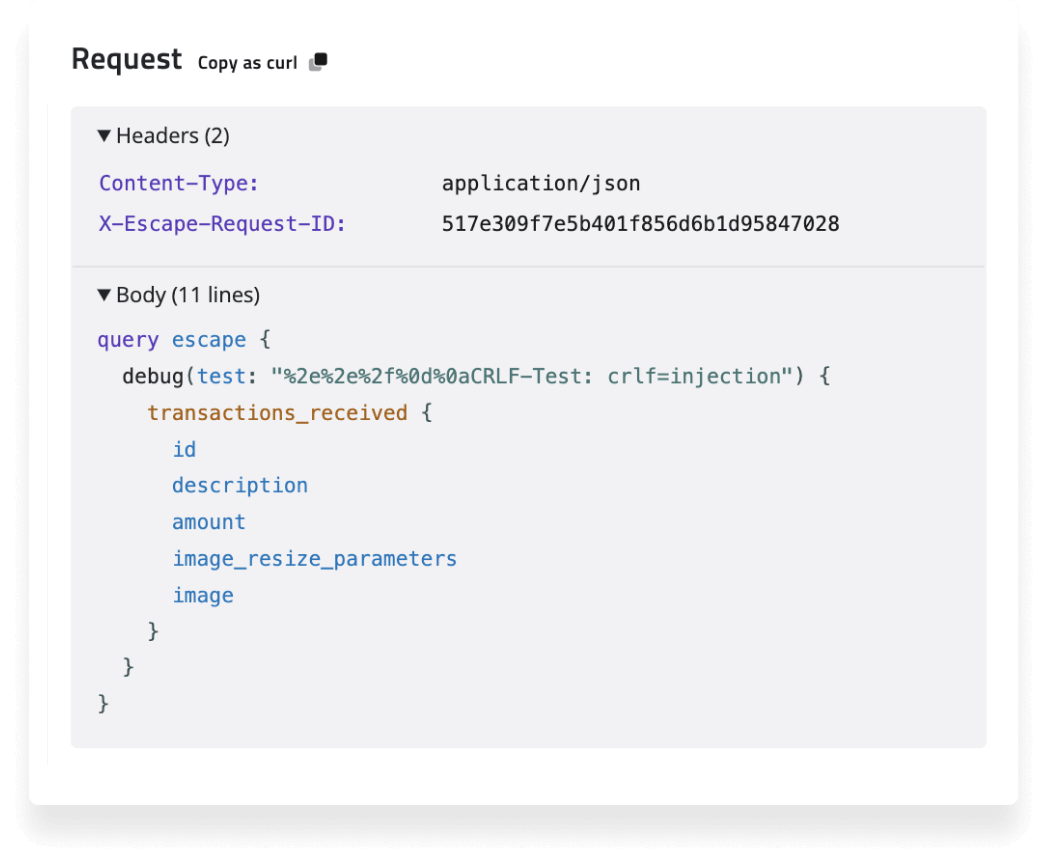
During the scan, Escape DAST scanner sends a custom header (X-Escape-Request-ID) with each request sent to your API endpoint. This lets us know when we sent it and when we received it. We call this request tracing. The scanner keeps track of all response times and puts the concerning requests in a queue.
After the scan, we synchronize the queue to ensure the flagged requests outline performance problems in your app.
- Detailed Reports: After scanning your API, Escape DAST provides in-depth reports that highlight slow-performing queries and offer actionable insights to help you optimize your GraphQL endpoints.
- Seamless CI/CD Integration: Escape DAST easily integrates with your existing CI/CD pipeline, making continuous performance testing a part of your development process.
How can you improve your GraphQL performance?
Here is the performance issues view of a scan run with Escape DAST Scanner that handles GraphQL natively, which enables you to detect and fix your performance problems.
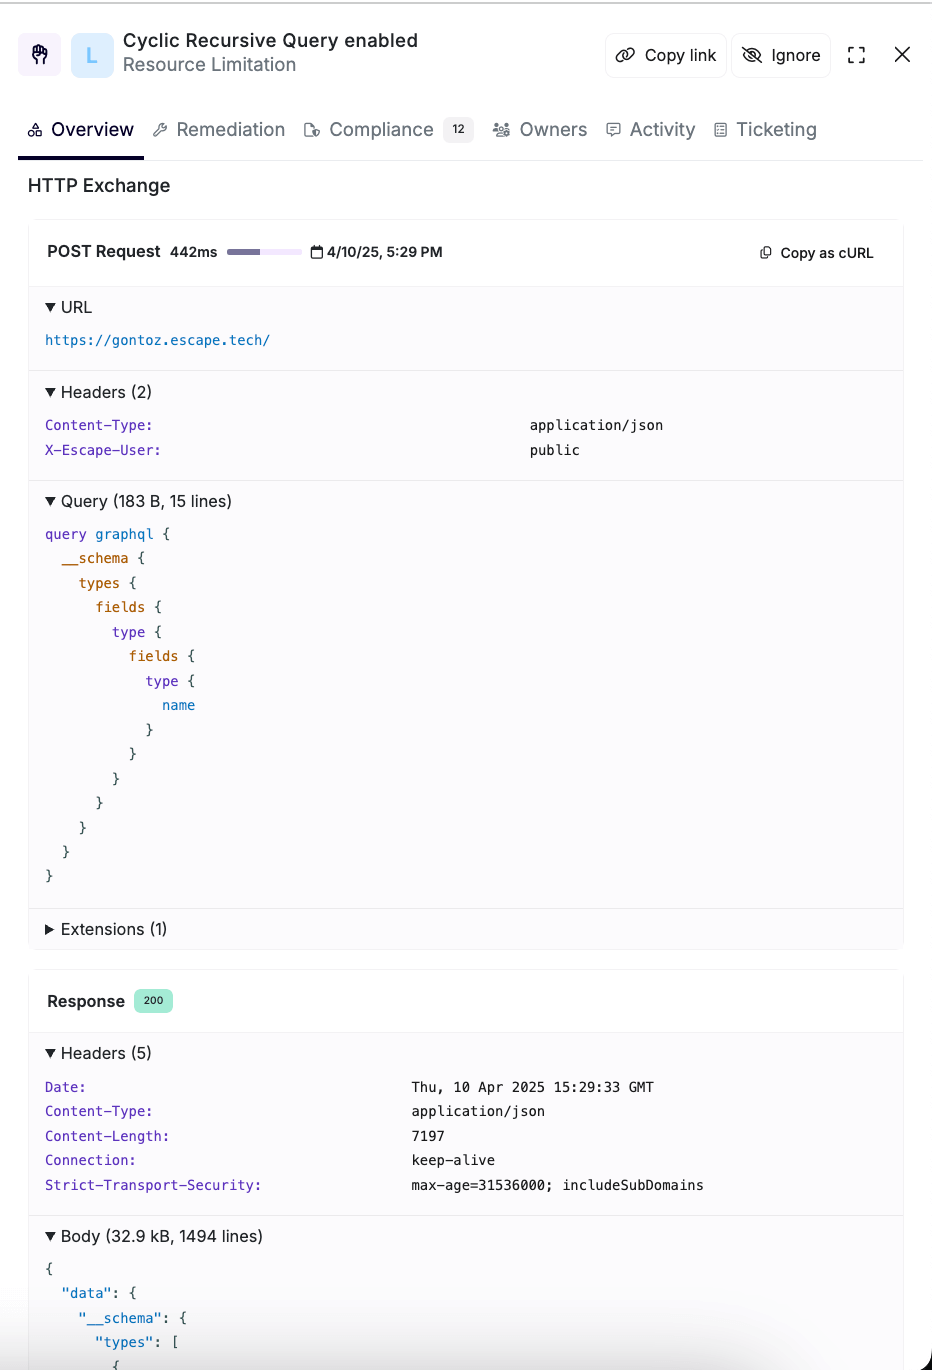
When a cyclic recursive query is allowed, it can lead to performance degradation as the server spends more and more time trying to resolve each nested field. In our example, even with just a few nested levels, the server can experience a response time of 442ms due to the excessive processing needed to handle each recursion. For larger or more deeply nested queries, the performance hit can be much worse, causing significant delays and even server timeouts.
You can also read our documentation about DOS and complexity to learn more about security timeout.
You can see how to reproduce the request by copying the query and trying it yourself:
But you shouldn't wait for performance issues to affect your users. By proactively testing and optimizing your GraphQL API, you can ensure a fast, reliable user experience. Escape DAST is the tool you need to stay ahead of potential performance problems and secure your GraphQL API at the same time.
Ready to get started? Request a demo and see how Escape DAST can streamline your performance testing process.